ANL501 Data Visualisation and Storytelling
View the Project on GitHub nicholas-sim/ANL501-Data-Visualisation-and-Storytelling
Seminar 6
This seminar explores further approaches to visualize geo-spatial data. It first explores the application of the ggmap library to fetch Google maps as base maps for the construction of chloropleth maps as well as geocode locations, then other plotting approaches such as leaflet. The seminar wraps up with a discussion on how to construct a compelling data visualization for storytelling by first storyboarding the visualization.
Further Approaches for Geo-Spatial Visualization
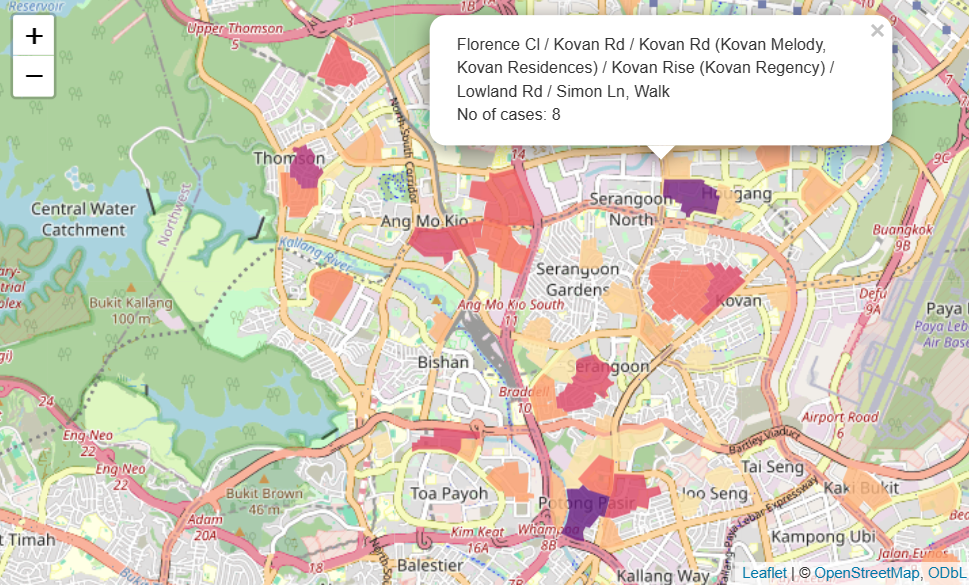
This discussion considers further capabilities in R for constructing visualizations for geo-spatial data. First, we explore constructing chloropleth maps using map data from formats such as the shape and geojson files. We then explore the application of the ggmap library to fetch base maps from the Google Map Platform, such as Google map, OpenStreet map, and Stamen map, and how chloropleth maps can be constructed using such base maps. The discussion looks at other features such as geocoding locations for free using tidygeocoder and the OneMap API (for the case of Singapore), as well as using the leaflet package to construct dynamic visualizations. As an example, we explore constructing chloropleth maps on dengue clusters based on the number of addresses reported in the data.
This discussion focuses on creating a storyboard before to construct data visualizations with compelling storytelling elements. The storyboard consists of 4 guiding questions: 1) What is the big idea? 2) What is the intended message? 3) How do you plan to demonstrate it? 4) How would you draw attention to your findings? We then explore two examples on how the data story element in a visualization can be improved by thinking about whether and how the visualization has addressed these questions.