ANL501 Data Visualisation and Storytelling
View the Project on GitHub nicholas-sim/ANL501-Data-Visualisation-and-Storytelling
" A most gruesome and nerve-racking assignment to finish as my last module with SUSS in exchange for the master's certificate "
This repository contains the class materials for ANL501 Data Visualisation and Storytelling, a course offered by the Master of Analytics and Visualisation (MAVI) programme at SUSS. Thanks to all current and past students whose feedback has contributed to improving the course.
| Data Scraping from Wiki using Reticulate | Lollipop Chart on Life Expectancy |
|---|---|
 |
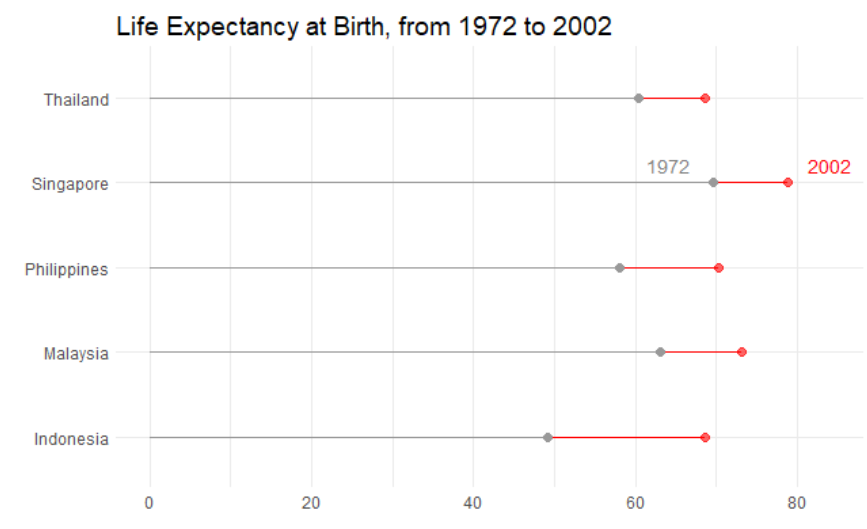 |
In this course, we explore the use of R programming to construct data visualizations. The course follows Data Visualization: A Practical Introduction by Kieran Healy and the course introduction can be found here [ Seminar 1 ]. While no prerequisites are required, some exposure to programming would be beneficial for students. Nevertheless, before going into data visualizations, we will introduce R and ensure everyone is proficient in working with and manipulating data frames using it. You may access the lecture slides below. The course is structured as follows:
Introduction to R Programming
- R Operations [ Seminar 1 ]
- R Programming [ Seminar 1 ]
- Data Management in Base R [ Seminar 2 ]
- Data Management in Tidyverse [ Seminar 2 ]
Data Storytelling Principles
- Data Storytelling Practices [ Seminar 1 ]
- Principles of Data Storytelling and the Grammar of Graphics [ Seminar 2 ]
- Storyboarding for Data Visualization [ Seminar 6 ]
Data Visualizations
- Getting Started with ggplots [ Seminar 3 ]
- Data Preprocessing for Data Visualization
- Plotting Trends and Time Series: Line Charts, Area Charts, Path Plots [ Seminar 4 ]
- Plotting Distributions : Bar Plots, Histograms, Kernel Density Plots [ Seminar 4 ]
- Comparing Distributions : Column Plots, Box Plots, Dot Plots, Jitter Plots, Tree Maps [ Seminar 5 ]
- Improving Data Storytelling: Labels and Annotations [ Seminar 5 ]
- Plotting Geospatial Data: Choropleth Maps [ Seminar 5 ]
Other Topics
- RMarkdown for Reproducible Report for Analytics [ Seminar 4 ]
- Integrating Python with R using Reticulate (various parts in Seminar 4 and Seminar 5 )
- Further Issues in Geospatial Visualization (ggmap, plotting various shape files) [ Seminar 6 ]
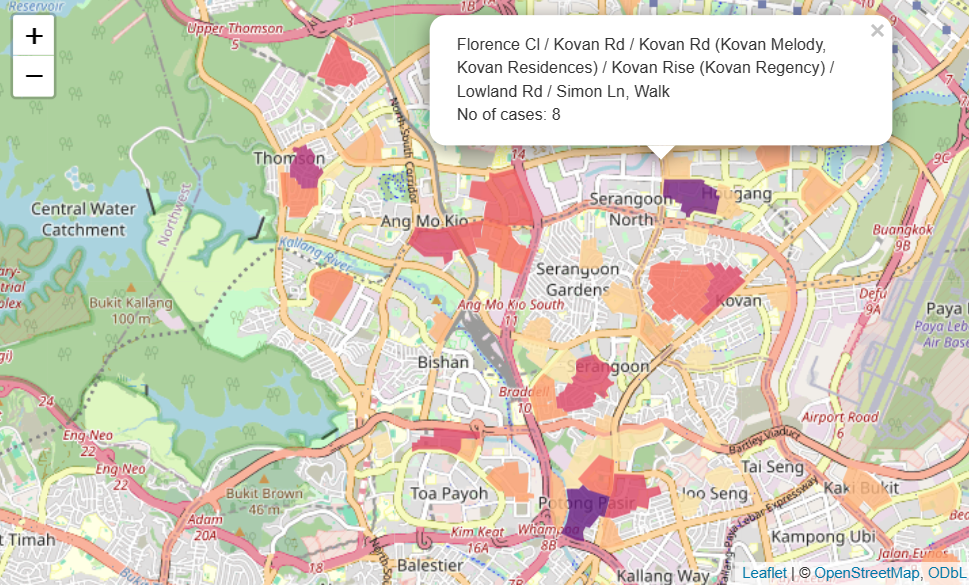
- Interactive Geospatial Plots with Leaflet [ Seminar 6 ]
- Webscrapping with API
- Creating a Data Visualization Portfolio on Github